Table of contents
Apply profile r_test (if not already)
See Day+1#Apply_profile_r_test if needed:1.2. Install PluginR (if not already)
Through admin mods. See Day+1#Install_PluginR if needed.1.3. Play with simple R commands in your wiki home page
Write a few R commands inside some R plugin call, and some inside some RR plugin call.1.4. Create a new wiki page
See how to create a new page.- Through main menu: "Menu > Wiki > Create a Wiki page"
- or by surrounding any piece of text with double round brackets:
new page
This might be reused as a page for your interface later on, after renaming if needed, etc.
1.5. Play with the r_test pages
After you applied the r_test profile (Day+1#Apply_profile_r_test), you have a series of pages created for you with different R commands shown, as well as a simple interface to manage your program runs, etc. (r_test3).
Have a look at them, edit those pages if needed to see how they are created, etc.
You can access them through the menu that you have been created in the right column of your Tiki site.
1.6. Start your interface
- Each person creates a new wiki page for testing purposes (15'):
You can do so through the column at the right where it says: Search, and a filed is shown to write your new page name, and click at the button Edit.- For instance, if your name is "Pepe", write something like:
powerAnalysis_pepe - Write some call to PluginR and to PluginRR. Check the pages r_test01_simple_test, r_test02_params, r_test05_wordcloud & r_test06_googleVis, for instance) that you have linked in the column at the right hand-side.
- For instance, if your name is "Pepe", write something like:
- Once your trials are finished, do some cleaning at the page, in order to continue with the design of our new interface: tracker (database & forms generator), tracker fields, and wiki pages associated with it (15').
We will create a form to calculate the power of a t test of two sample comparison. We will use the function pwr.t.test from the package pwr. You can find more information about it here: http://www.statmethods.net/stats/power.html.- You have to create a "tracker", to host the values of the parameters for each analysis (one tracker ítem filled with the parameters in the corresponding tracker fields for each analysis). Therefore, create the tracker first: http://youruser.r.tiki.org/tiki-list_trackers.php
- Create the tracker fields for your tracker afterwards. Note which parameters you do need looking at the example page r_test_power. For instance, something like:
- You can import a valid configuration for your fields from something like you can find in this file:
campos_del_tracker_exportados_para_importar_de_nuevo.txt
- At the end, the form to enter your data directly from the screen of your tracker (tiki-view_tracker.php?trackerId=5; change 5 with the name of your tracker Id) must show something like:
- If any field needs values for a dropdown list, you can add them editing the tracker field. Go to the tracker, go to edit fields, edit the field you are interested in, and change the values for the dropdown list.
- You can import a valid configuration for your fields from something like you can find in this file:
- You have to create a "tracker", to host the values of the parameters for each analysis (one tracker ítem filled with the parameters in the corresponding tracker fields for each analysis). Therefore, create the tracker first: http://youruser.r.tiki.org/tiki-list_trackers.php
- Currently, we can already come back to design our interface, in our main page (powerAnalysis_pepe). We will do 3 sections in that page: (15')
-
- "Form to submit your data", with this type of content:
{tracker trackerId="2" fields="7:8:9:10:12:11"}}
Ensure that you use your tracker Id number, as well as the corresponding field id numbers in your own case of your tracker.
More information about that plugin in: https://doc.tiki.org/PluginTracker
- "List of analysis performed", with this type of content:
{trackerlist trackerId="2" fields="7:8:9:10:11:12" showlinks="y" ignoreRequestItemId="y" url="tiki-index.php?page=Day 2&itemId="}
Ensure that you use your tracker Id number, as well as the corresponding field id numbers in your own case of your tracker.
More information about that plugin in: https://doc.tiki.org/PluginTrackerList
- "Result of the power calculation", with this content so far:
{trackerlist trackerId="2" fields="7:8:9:10:11:12" tplwiki="powerAnalysis_template_pepe" max="1" view="user" showpagination="n"}
Please note that this time we have added some different parameter, among which you can see that we indicated that we want to use a template in a wiki page ("tplwiki="), despite we have not created this page "powerAnalysis_template_pepe yet. Let's create it now.
- "Form to submit your data", with this type of content:
-
- Each person has to create a new page: one for the results template, with a name like (10')
powerAnalysis_template_pepe
Like before, you can do so through the right-hand-side column, where it says: Search: write the new page name, and click at the button Edit- Write this contenet inside:
{wikiplugin _name=rr} require(pwr) ; pwr.t.test(n={$f_9},d={$f_10},sig.level={$f_11},alternative="{$f_12}"){/wikiplugin}
Ensure that you write the corresponding field names for your own case. You can check it going to the list of trackers from your Tiki site http://youruser.r.tiki.org/tiki-list_trackers.php ) and clicking at the table icon that you will see there ( ).
).
- Change the permissions to the wiki page so that this page can:
- be viewed by anonymous users: grant them the permission Can view page/pages (tiki_p_view)
- be used by anonymous users as tracker template ("Can use the page as a tracker template" - tiki_p_use_as_template ). Grant this perm only to the users of group Registered, if you prefer (this permission is needed by the group of users that need to see the results from your analysis with R)
- be configured in a way that only the groups of users of trusted editors have permission to edit this page. This step is important in order to avoid compromising the security of the server.
- We can change the permissions site wide for wiki pages from the administration menu Admin home > Permissions > Wiki
- To the anonymous users we grant them the permissions:
- Can view page/pages (tiki_p_view)
- Can use the page as a tracker template
- To the anonymous users we grant them the permissions:
- Write this contenet inside:
And that should be enough to have your interface running: go again to your page powerAnalysis_pepe, and fill in the fields of the form to run a new analysis to calculate the power of a test.
Congratulations!
1.7. Backup your Tiki website
SUMMARY: Backup in 2 simple steps
Two types of things in a standard Tiki installation must be saved for a backup of your specific site:
Backup your MySQL database. (see below for examples)
Backup your files.
Copy via (S)FTP your entire folder where Tiki is installed (and all subfolders)Make sure to also backup your files that are outside the web directory (if you set up your Tiki this way; not done by default, but attachments and other file uploads go into the mysql database)
1.7.1. Backup the files
If you configured the file gallery (or any feature) to store files elsewhere than where Tiki is installed (ex: outside the web directory), you need copy these files too. (see tiki-admin_system.php)Remember that by default this is not done, but attachments and other file uploads go into the mysql database directly.
1.7.2. Backup the database
Your web host will usually provide a tool to backup your database. Here you have various options.A. Backing up through Web interface (Adminer)
Adminer (formerly phpMinAdmin) is a full-featured MySQL management tool written in PHP. Conversely to phpMyAdmin, it consist of a single file ready to deploy to the target server.B. Backing up through Web interface (phpMyAdmin)
If needed, ask your system admin if they provide phpMyAdmin in that hosting, and where is it located for you to access it.Eventually, you could get phpMyAdmin software to install it yourself: http://www.phpMyAdmin.net/
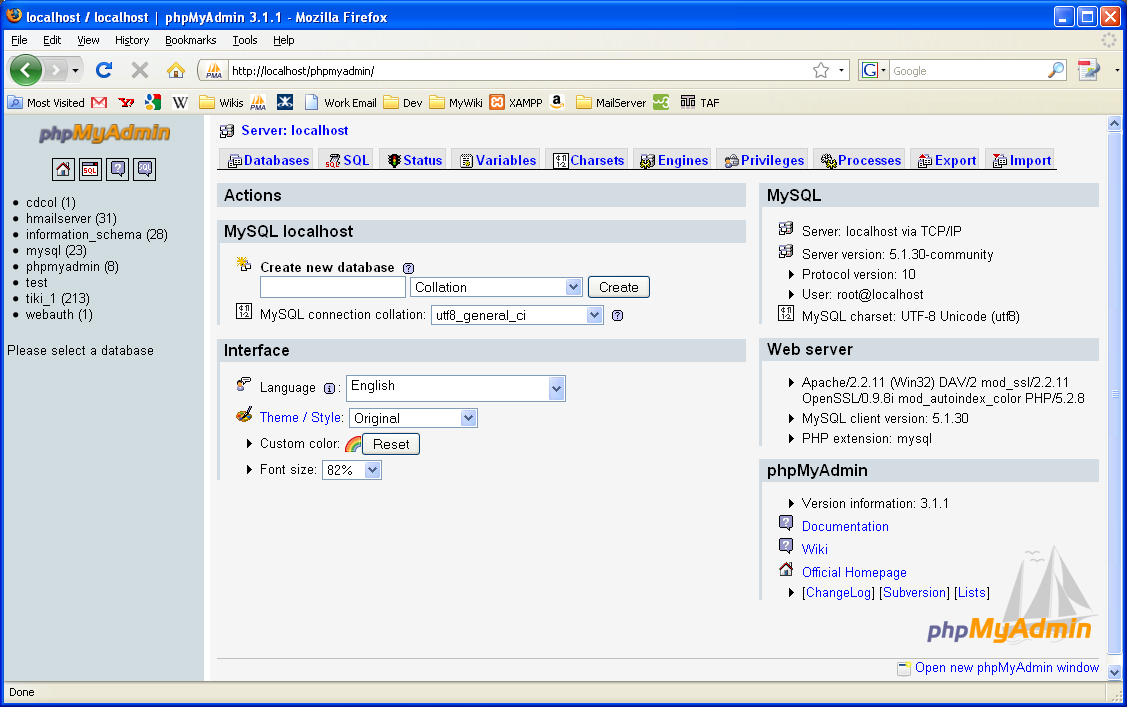
The main screen in phpMyAdmin looks like:
(most screenshots are taken using the TikiLiveCD: http://tiki.org/TikiLiveCD)
 }
} |
Select your mysql database from the list (tiki19 in this example; tiki_1 in screenshot below), at the drop down from the left column of the screen. You will see then something like:

Click on the tab that says SQL (or Export, in newer versions of phpMyAdmin):
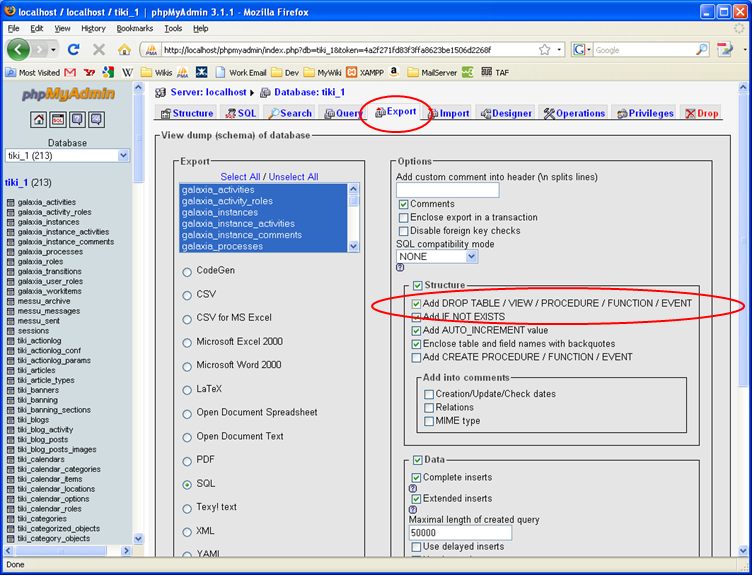
At the export screen, make sure that you check the box from the section "Structure", that says "Add DROP TABLE", since it will be much easier the process to re-insert a backup later on from this same database that you are now exporting.
The rest of options are ok as seen by default.
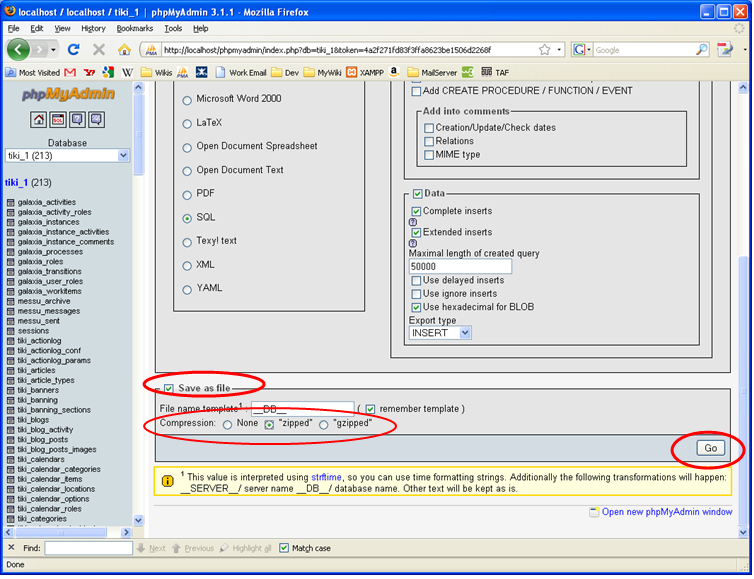
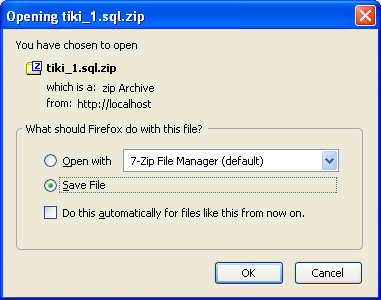
At last, select the box "send", and click on the button "Execute". You will see a dialog menu like this one:
Save it on disc at your preferred location.
We will now open it to check that everything is all right (and to let you show the type of file saved, if this is new to you):
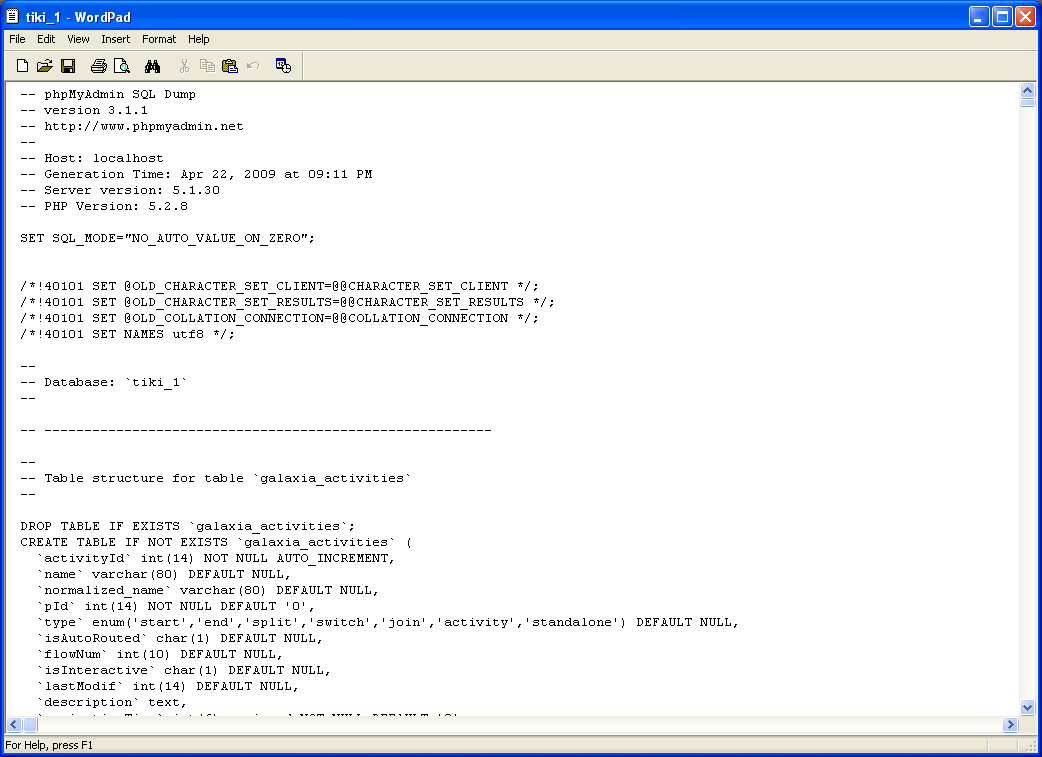
The file has to be encoded in utf-8. If we want to change the character set to, for instance, iso-8859-1 (to be able to edit it with most MS Windows applications that didn't cope well with other charsets different from that default), we can do it direcetly from true "utf-8 enabled" editors (see http://doc.tiki.org/ToolBox) pages for links on common applications to do that depending on your operating system). For instance, using KWrite, on GNU/Linux, it would look like:
1.7.3. Backing up through commands at a terminal screen (mysqldump)
Write a command like:
mysqldump -uuser -ppass tiki19 > tiki19_backup_yymmdd.sql
In your case, change in the example above:
- user for your username at the mysql server
- pass for the password for that username at the mysql server
- tiki19 for your database name, and
- yymmdd for the two digits of year, month and day, respectively, for instance, to have your backups easily sorted by name and date of creation also.
Then, save your backup copy on a safe place. It's recommended to send by ftp or sftp that file to your local computer to prevent problems if server hardisk and backups fail at any time.
To restore, please see: http://doc.tiki.org/Import+Database
1.8. Optional: Apply profile R_Heatmaps
If you want to see a slightly more advanced example, which includes graphical output also and an interface with several separate pages (one for the list of analysis, and one for editing and viewing the results), you can apply the configuration profile R_HeatmapsApplying the advanced configuration profile "R_HeatMaps"
You can test live the application to generate Heatmaps in png, svg and/or pdf, at the Bioinformatics Tools website, from the Statistics and Bioinformatics Unit, at the Vall d'Hebron Research Institute:
http://ueb.vhir.org/tools/Heatmaps